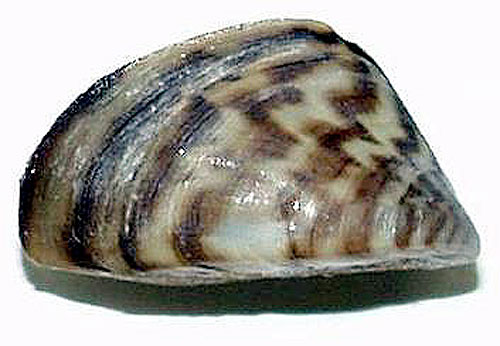
Tuesday, November 30, 2010

Invasion causes resource switching

This article highlights some of the impacts zebra mussels have had on the Great Lakes ecosystem. The authors tested the hypothesis that feeding ecology and depth distribution of lake whitefish have changed with the establishment of dreissenid mussels in the Great Lakes.

Lake Whitefish
Contemporary samples of lake whitefish diets and catch records along with isotopic signatures of lake whitefish and benthic invertebrate tissues were contrasted with previously unreported historic data to demonstrate a greater reliance of lake whitefish on nearshore resources following dreissenid colonization.

Lake whitefish diets were stable over the available 50 year record previous to zebra mussel invasion (1947-1997). After zebra mussel establishment (2001-2005), there was a sudden change in isotopic signatures (3% enrichment in 13C and 1% in crease in 15N). The shifts in signatures coincide with shifts in mean depth of capture of lake whitefish towards the nearshore.
Fig. 4  Box and whisker plot of lake whitefish scale isotopic signatures of a δ13C b δ15N in South Bay, Lake Huron, collected from age 5 fish before dreissenid establishment (open boxes) and after establishment (2001–2005, shaded boxes).
Figure 4 illustrates how the isotopic signatures of lake whitefish have changed after zebra mussel invasion. From this figure it's easy to see the increase in δ13C over time after invasion suggesting more littoral carbon sources relative to pre-invasion samples. There is also a noticeable decline in δ15N after invasion suggesting possible restructuring of food chains or trophic levels OR a significant dietary shift in lake whitefish relative to pre-invasion lake whitefish samples.
Fig. 7 Seasonal diet composition of lake whitefish in South Bay, Lake Huron, collected in a 1947 and b 2005. Predominantly profundal prey are solid shades; predominantly littoral prey are patterned segments; pelagic prey (primarily Bythotrephes) are open segments with checkerboard pattern. Numbers above bars are percentage of fish collected with stomach contents. “Avg.” is the average diet composition over the entire year, weighted by the percentage of fish with stomach contents. Depth zone 3 is >30 m depth, as per McNickle et al. (2006).

Figure 7 has a lot of information packed into it. The main point is to focus on shifts in the dietary components pre and post zebra mussel invasion. Lake whitefish diets have gone through a complete overhaul since the invasion. You see pre-invasion diets shift from primarily diporeia, sphaeriidae and chironomids (more pelagic prey) to gastropods, dressenids and ephemeropterans (more littoral prey). This supports the isotope data compiled in Figure 4.

Dietary shifts in the lake whitefish could mean drastic changes in energy flow, potentially impacting their health and condition. This could have huge implications on the lake whitefish fishery as there may be fewer, and potentially smaller fish, thus reducing catch quotas and increasing fishing efforts.

This study was first to report changes in the carbon source available to lake whitefish associated with restructured benthic communities after the appearance of dreissenid mussels. This study contributes to a growing body of work that demonstrates the ecological insights that can be gained through isotopic analysis of archived fish bony tissues in ecosystems that have experienced significant levels of disturbance.

Reference:
Rennie, M.D., Sprules, W.G., Johnson, T.B. (2009) Resource switching in fish following a major food web disruption. Oecologia 159(4): 789-802.

Zebra mussels screw everything up

This study documented changes in the overall density and composition of benthic invertebrate communities in South Bay associated with the invasion of zebra mussels (D. polymorpha). The quagga mussel, D. bugensis, had not invaded South Bay at the time of this study.

Fig 3. Interaction of year and depth zone on log(x+1) mean density of organisms (one standard error is shown but is not visible on log scale) for various taxonomic groups. Depth zones 1, 2, and 3 correspond to shallow, intermediate and deep respectively. For clarity, depth zone values are offset for each group.
Figure 3 shows density changes in four ecologically important macroinvertebrate species in South Bay pre- and post zebra mussel invasion. Overall, you can see there is a general decline in densities over the three depth zones. The most significant decline is seen in Diporeia, which is a main dietary component of a commercially important fish, Lake Whitefish.

Fig. 5 Interaction of year and depth zone on the mean relative abundance of organisms (one standard error of the mean is shown) for various taxonomic groups. Depth zones 1, 2, and 3 correspond to shallow, intermediate and deep, respectively.


Variety of macroinvertebrates commonly
found in North American freshwater
systems.

Figure 5 perfectly illustrates the changes in relative abundance of four ecologically important macroinvertebrates in the South Bay ecosystem. Diporeia decline in the deep zones, where as oligochaeta and chironomidae appear to increase in this zone. There are drastic decreases in chironomidae in the shallow and intermediate zones and slight increases in oligochaeta in these zones. Figure 5 suggests there a potential restructuring of the benthic community resulting from the establishment of zebra mussels.

This study did a great job at illustrating changes in the benthic community, and the implications of these changes on native species, after the invasion of zebra mussels.
 
One of the limitations of this study was the lack of information necessary to make biomass estimates. Looking at biomass instead of abundance may influence the results of this study.

Reference:
McNickle, G.G., Rennie, M.D., Sprules, W.G. (2006) Changes in benthic invertebrate communities of South Bay, Lake Huron following invasion by zebra mussels (Dreissena polymorpha), and potential effects on lake whitefish (Coregonus clupeaformis) diet and growth. Journal of Great Lakes Research 32: 180-193.

Friday, November 26, 2010

Trying to fit a square peg into a round hole

This is a quick review of a paper discussing a relatively new technique in food web comparisons across multiple ecosystems using stable isotopes. Layman et al. (2007) report a new methodology for quantitatively characterizing community-wide aspects of trophic structure.

The authors review six community-wide metrics reflecting important aspects of trophic structure based on δ13C - δ15N bi-plots. The metrics discussed revolve around a "Convex Hull" that is formed by joining all peripheral isotopic signatures in a δ13C - δ15N bi-plot. An example of this is illustrated in Fig.1 below.
Fig.1 Stable isotope bi-plots based on species collected from a Bahamian tidal creek. Each point on the graph represents the mean value of 2–9 individuals of that particular species with error bars around the mean omitted for simplicity. Calculation of community-wide metrics was based on the distribution of species in niche space: diamonds, fish; squares, crustaceans; triangles, mollusks; and circles, other invertebrate taxa. Solid symbols are used to illustrate how individual species' niches, and dispersion of those niches, affect values of the community-wide metrics. The convex hull used to calculate the TA metric is represented by the dotted line.
The six metrics include: δ15N range,  δ13C range, Total area, Mean distance to centroid, Mean nearest neighbour distance and Standard deviation of nearest neighbour distance.

1) δ15N range - Distance between the two species with the most enriched and most depleted δ15N values. This is one representation of vertical structure within a food web.

2) δ13C range - Distance between the two species with the most enriched and most depleted δ13C values. This provides insight into basal carbon sources for the food web. Increased values would be expected in food webs in which there are multiple basal resources with varying δ13C values.

3) Total area - Convex hull area encompassed by all species in δ13C - δ15N bi-plot space. This represents a measure of the total amount of niche space occupied, a proxy for the total extent of trophic diversity within a food web.

4) Mean distance to centroid - Calculated taking the average δ13C and δ15N values for the entire food web (centroid), and determining the distance from individual isotope signals to the centroid. This metric provides a measure of the average degree of trophic diversity within a food web.

5) Mean nearest neighbour distance - Just as it sounds, this is the mean of the Euclidean distances to each species' nearest neighbour in bi-plot space. This is a measure of the overall density of species packing.

6) Standard deviation of nearest neighbour distance - This is a measure of the evenness of species packing in bi-plot space that is less influenced than nearest neighbour distance by sample size

Here is an illustrated example provided by the authors that really helps in understanding these metrics.

Fig. 2. Conceptual models (B-D) of different ways food web structure can be altered through the addition of three new species to an existing tidal creek food web (A). Symbols are consistent with Fig. 1, and solid symbols represent a new species added in each scenario. The ways  community-metrics will vary under each scenario are depicted below each graph.
 I was really excited when I read this paper. It gave me another perspective when answering my thesis questions. I think this method is would be a perfect match for determining community shifts (or lack thereof) after the insertion of a new species into the food web. Changes in these convex hulls will provide insight to the community response to the invading species.

This article is a great read. There are some set-backs and limitations with this technique, but it is fairly new in food web ecology field. Enjoy!

Reference:
Layman, C.A., Arrington, D.A., Montana, C.G., and Post, D.M. (2007) Can stable isotope ratios provide for community-wide measures of trophic structure? Ecology 88(1): 42-48.

Wednesday, November 24, 2010

Shrimp food

This paper review is complimentary to my previous blog post. The Marty et al. (2010) study updated the distribution of Hemimysis in the Great Lakes, described the physical characteristics of sampled Hemimysis communities using length-weight relationships, interpreted variations in stable isotopes (carbon and nitrogen) in relation to food web dynamics, and described the temporal dynamics of Hemimysis within a food web with respect to food sources and trophic position.
Fig. 3 Linear regressions predicting wet (top)
 and dry (bottom) weight (mg) based on
body length (mm). Black circles Lake
Ontario, clear circles Lake Erie, and
black triangles Lake Michigan.
 
Highlights:

They produced a great weight, length regression (Figure 3).

They found that Hemimysis can feed on multiple carbon sources including pelagic and littoral autochthonous and terrestrial carbon. The isotopic signatures ranged from -24.5‰ to -30.2‰ and 12.2 to 15.0‰ for carbon and nitrogen respectively for individuals sampled on a single date and location in Lake Erie.

The amount of variation in signatures suggest an extremely variable diet. This makes it hard to determine specific food web impacts of this new invasive.


I thought the nitrogen and carbon relationship (Figure 4) was great. This suggests that Hemimysis feed on littoral and pelagic algal sources and as an individual moves from pelagic to littoral sources, their trophic position decreases. This could increase connectivity between littoral and pelagic food webs when consumed by predators from higher trophic levels.

Fig. 4 δ15N vs. δ13C of individual
Hemimysis  from Lake Erie (‰) (top)
and residuals of the δ15N/δ13C
relationship vs. C:N ratios of
Hemimysis.


Final thought:

This was an extremely interesting study. The authors tackled a lot of essential questions surrounding the biology of Hemimysis anomala. It is a good start in piecing together possible impacts on the Great Lakes ecosystem.

Reference:
Marty, J., Bowen, K., Koops, M.A. (2010) Distribution and ecology of Hemimysis anomala, the latest invader of the Great Lakes basin. Hydrobiologia 647(1): 71-80.

Tuesday, November 23, 2010

Don't let looks deceive you

The Yellow Iris, also known as Yellow Flag (Iris pseudacorus) is an emergent, perennial aquatic plant; common in southern Ontario and parts of southern Canada. I honestly didn't know this plant was an invasive species so I was surprised to see in my invasive species field guide.

Amzaing picture of Yellow Iris (I. pseudacorus).
When researching this particular invasive I found that its first recorded occurrence in Canada was in Newfoundland in 1911 and by 1940 had found its way to Ontario. It's native range is listed as Eurasia, but other sources have suggested British Isles., North Africa and Mediterranean regions.


Yellow iris in an ornamental garden.

It's suggested that Yellow Iris found it's way into Canada via ornamental water gardens. You can buy this species online to plant in your ornamental pond for some added flare. The flower is very attractive (as flowers go), so it makes sense that people would want to buy this species to spice up their otherwise boring water gardens.

Unfortunately, it spreads easily. If planted near shorelines, the Yellow Iris will quickly begin to inhabit surrounding areas. It can escape into new areas as plant material is discarded (intentionally or unintentionally) into waterway and/or carried off by flooding during heavy rain events. It can also spread through water bodies via rhizome fragments and possibly fruit or seed that are transported with recreational water vehicles or their associated trailers.

Yellow iris can for tall, dense stands in the water column. This can displace other aquatic organisms, impede water flow, boating traffic, swimming, fishing, and hinder many other recreational activities. It has also been known to clog irrigation pump filters.

So next time you see one of these gorgeous flowers, don't be fooled. It could someday ruin your favourite fishing hole!

Losing life one filter at a time

Zebra mussel showing characteristic striping.
I can't rightfully call myself an invasive species blogger if I don't discuss one of the most well known invasive in North America: the zebra mussel.

Zebra mussels are the small mussels you commonly see covering rocks and piers all over the Great Lakes. Their shells are sharp (the reason I bought good quality water shoes) and have a striped pattern, giving them their name.

They are very similar to another invasive mussel, the quagga mussel. The easiest way to tell the which mussel you're looking at is to place the mussel on a flat surface. If it stays up, you have a zebra mussel (relatively flat underside), it it falls over you have a quagga (rounded underside).

Both invasive mussels hail from the same Ponto-Caspian region of Europe (Black, Caspian and Azov seas) and their expected vector for introduction is ballast water exchange.


Various types of phytoplankton - food for zebra mussels.

Zebra mussels are filter feeders, primarily consuming phytoplankton. Large populations of zebra mussels in the Great Lakes and Hudson River reduced the biomass of phytoplankton significantly following invasion (Holland 1993).

Phytoplankton fuel offshore and nearshore foodwebs so a reduction in this essential organism will cause bottom-up effects in the native foodweb most likely causing a reduction in health, condition and ultimately population size of organisms in  higher trophic levels.

There are many ecological, economic and social impacts associated with zebra mussels. I've listed a few to to get an idea of their impact:

Zebra mussels encrusting a water intake pipe.

- Constriction of flow on water intake pipes, affects heat exchangers, condensers, fire fighting equipment, air conditioning and cooling systems.

- Increased drag on ship due to zebra mussel attachment (higher fuel cost, longer trip duration, etc.)
- Detrimental effects on health and condition of native fish species
- Biomagnification of Polychlorinated Biphenyls (PCBs)

For more information on this organism you can visit the following sites:
http://nas.er.usgs.gov/queries/factsheet.aspx?speciesid=5
http://www.mnr.gov.on.ca/en/Business/Biodiversity/2ColumnSubPage/STEL02_167267.html
http://seagrant.psu.edu/publications/fs/zebraquagga2007.pdf

Friday, November 19, 2010

A Dentist's Nightmare

Ships moving through Welland Canal.

Another attractive fish species, the sea lamprey (Petromyzon marinus), invaded the Great Lakes in the 1830s after a man-made canal system granted easy access to the basin. They moved from Lake Ontario to the rest of the Great Lakes after the completion of the Welland Canal in 1919.

The sea lamprey is  primitive fish with a cylindrical body and cartilage instead of bones. They do not have scales or a lateral line, paired fins or swim bladder. They are a parasite, which attach themselves to fish with their suction cup mouths and use their many teeth and rasping tongue to feed on fish blood and bodily fluids.

Sea Lamprey - enough to give anyone the heeby jeebies.
The sea lamprey was a large contributing factor to the collapse of the Great Lakes fishery. A single lamprey can kill upwards of 40 pounds of fish during their adult life stage. Only 20% of fish will survive an attack from a sea lamprey, but those that survived must cope with the resulting wound, which increases susceptibility of disease an infection. Canada and the United States harvested approximately 15 million pounds of lake trout from Lakes Huron and Superior per year. With sea lamprey numbers at their peak in the early 1960s, the catch was only about 300 000 pounds per year.

The Great Lakes Fishery Commission has collaborated with both Fisheries and Oceans Canada and the U.S. Fish and Wildlife Service to control and decrease populations of sea lamprey and to reduce the impact of this species on native fish populations. Several initiative and programs have been implemented including:

 1) application of chemicals such as TFM to sea lamprey spawning streams (selectively kills lamprey larvae)
2) construction of barriers allowing native fish to pass but prevent migration of sea lamprey
3) release of sterile males to compete with fertile males, which decreases reproductive success

New research in the use of sea lamprey sex pheromones may replace the use of chemicals (such as TFM) for controlling/removing spawning sea lamprey individuals. Sea lamprey populations have decreased by 90% from their peak in the 1960s. Need some type of conclusion in here.

Reference for most of the material reviewed in this blog. <http://www.invadingspecies.com/Invaders.cfm?A=Page&PID=3>